Monthly Newsletter – July 2019

Price appreciation has been a hot topic for some time, but over the last year, prices have started to balance out and it takes some explaining. As you can see from the map above provided by the National Association of Realtors, price appreciation over the long haul has been robust. The map above points out price appreciation since 2005, which was prior to the economic downturn. This demonstrates that if a homeowner was able to retain their home through the downturn of 2007-2012, that they came out on the other side well-positioned. Real estate is typically a long game, and that is one of the key points we will cover here.
First, let’s review price growth after the down turn. Since 2014, price appreciation has been out of the ordinary! The average (normal) price appreciation is 3-4% year-over-year. For clarity, “year-over-year” is defined by the last 12 months averaged over the previous 12 months. This is a larger data pull and tells a deeper story than just taking one month and comparing it over that same month the year prior like the media typically does.
Over these last five years, we have seen double-digit year-over-year appreciation, specifically from 2015-2018. In fact, 2018 started out with 14% price gains over 2017. This was due to rapid job growth, tight inventory, and low interest rates. It was the perfect storm to rapidly drive up prices. In the second half of 2018, interest rates started to rise, inventory had huge gains, and affordability became an increasing issue. This stalled out demand and prices came off their spring peak. The second half of 2018 brought on a price correction and started to lead a path toward more normal appreciation levels.
In the beginning of 2019, we saw year-over-year price gains average from 8-9%. As we finished out the second quarter of 2019, the year-over-year price growth continued to balance out toward typical, historical levels. We are at a place in the year-over-year data where the crazed price appreciation is no longer within 12 months, and we are tracking from the correction that happened in the second half of 2018, reflective of more normal inventory levels.
The majority of the large gains in 2018 happened in the first half of the year. Since May of 2018, inventory has grown, meaning we have seen more homes come to market, providing buyers more selection which tempers price growth. This has evened out price growth to more sustainable levels and aided in affordability. Coupled with the recent drop in interest rate (.75% since November 2018) the market has provided more ease for buyers to make purchases and for buyers that are sellers to make transitions without having to move twice. It is still a seller’s market with inventory levels under 3-months, but we are starting to move toward more balance. This is a good thing!
What does all of this mean? Quite a bit, but I’ll touch on some key points.
- Many homeowners are in very favorable equity positions, especially those who bought prior to 2016 (back to that long-game point).
- The days of owning your home for 1-3 years and turning a profit with a quick sale are a blip in history from 2015-2017.
- Buyers simply have more selection, so the homes that are in good condition, show-ready, and priced appropriately are seeing fantastic results such as quick market times, favorable terms, and full-price or sometimes over-list-price offers.
- Overpricing is becoming more common as home sellers wrap their heads around the new normal of price appreciation. Attention to market trajectory and aligning with a trusted professional can help avoid this pitfall.
- The more affordable areas have seen higher gains recently as the core areas balance out from hitting affordability ceilings.
- Historically low interest rates (lowest in three years!) continue to drive demand and should be as important to watch for a seller as they are for a buyer.
Below are some national price appreciation predictions from CoreLogic and various economists. It is predicted that we will continue to have price appreciation, but for it to be more subtle. The fear of equity loss on a national level from these experts is minimal. It is understandable that when price gains become more subtle that it may seem like the sky is falling, but it is important to keep the long game in perspective.
Real estate is a complicated investment to navigate, but one that can provide amazing opportunity. It also relates to big life choices; whoever said moving was easy? That is why aligning with a trusted professional is key to help make these life-changing transitions. If you are curious about the value of your home in today’s market or have thought about a move or even a first-time purchase, please reach out. It is my mission to help keep my clients informed and empower strong, life-changing decisions.
We’re halfway through the Windermere Foundation’s 30-year anniversary and there’s no sign of donations slowing down. In the second quarter of this year, the Windermere Foundation collected $556,937, bringing our year-to-date total to $865,029, and our grand total to $38,871,157 raised since 1989. These donations are used to support non-profit organizations and programs that help low-income and homeless families throughout the Western U.S.
Every Windermere office has its own Windermere Foundation fund account from which we make donations to help those in need in our local communities. These funds come from each real estate transaction that we close, as well as individual donations from agents, staff, and the community.
Thank you for your support! Together, we are able to make a real difference for those in need in our local communities.
All of us at Windermere are very excited to kick-off our fourth season as the Official Real Estate Company of the Seattle Seahawks!
Once again, our #tacklehomelessness campaign is front-and-center, with the Windermere Foundation donating $100 for every Seahawks home-game defensive tackle to Mary’s Place, a Seattle-based non-profit organization that provides safe, inclusive shelter and services supporting women, children, and families on their journey out of homelessness. We are looking forward to raising even more money – and awareness – for this important cause. 
Our partnership with the Seahawks and Mary’s Place fits perfectly with the mission of the Windermere Foundation which is to support low-income and homeless families in the communities where we have offices. Through the #tacklehomelessnesscampaign, we hope to be able to do even more.
Check out the Seahawks schedule here, the preseason is just a couple of weeks away!
South King County Quarterly Market Trends – Q2 2019
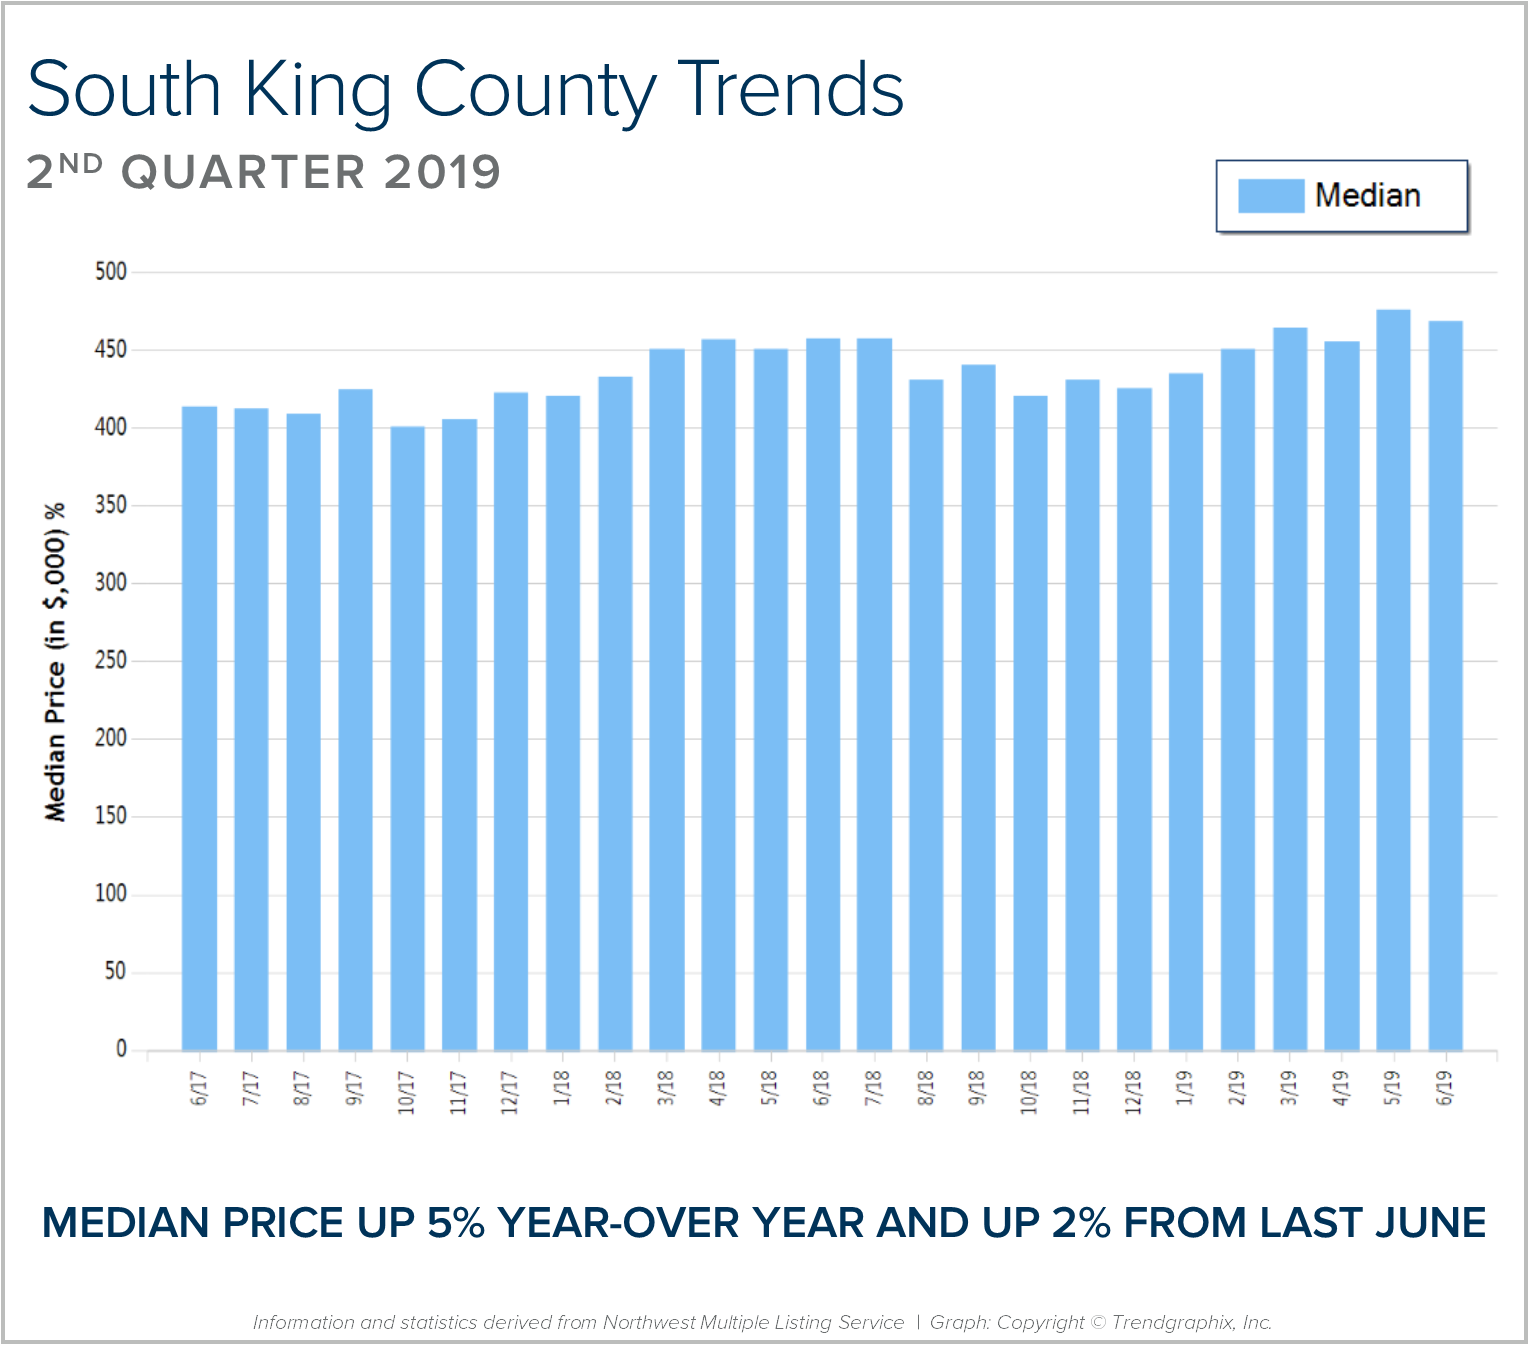
 2019 provided a very healthy and more balanced spring market! Median price is up 5% complete year-over-year and up 2% from last June. Prices have started to find their balance as more inventory has come to market compared to the scarcity of years past. While buyers have had more choices over the last year, it is still a seller’s market with just 1.3 months of inventory based on pending sales, resulting in an average of 28 days on market and 99% list-to-sale price ratio in June. Low interest rates continue to drive demand, however sellers who overprice or don’t address condition issues will linger on the market.
Our real estate market continues to be driven by low interest rates, positive job creation, and upbeat consumer sentiment. Currently, interest rates sit around 4% which is still an historical low, affording buyers the ability to make moves and reduce their debt service. Price appreciation has started to temper to more normal rates, compared to the double-digit appreciation we experienced over the last 3 years due to more sellers coming to market. This has created more balance and greater opportunity for buyers. The generational shift we are experiencing as Baby Boomers move towards retirement and Millennials enter into their prime earning years is an exciting exchange happening in the market place right now.
This is only a snapshot of the trends in south King County; please contact me if you would like further explanation of how the latest trends relate to you.
Eastside Quarterly Market Trends – Q2 2019
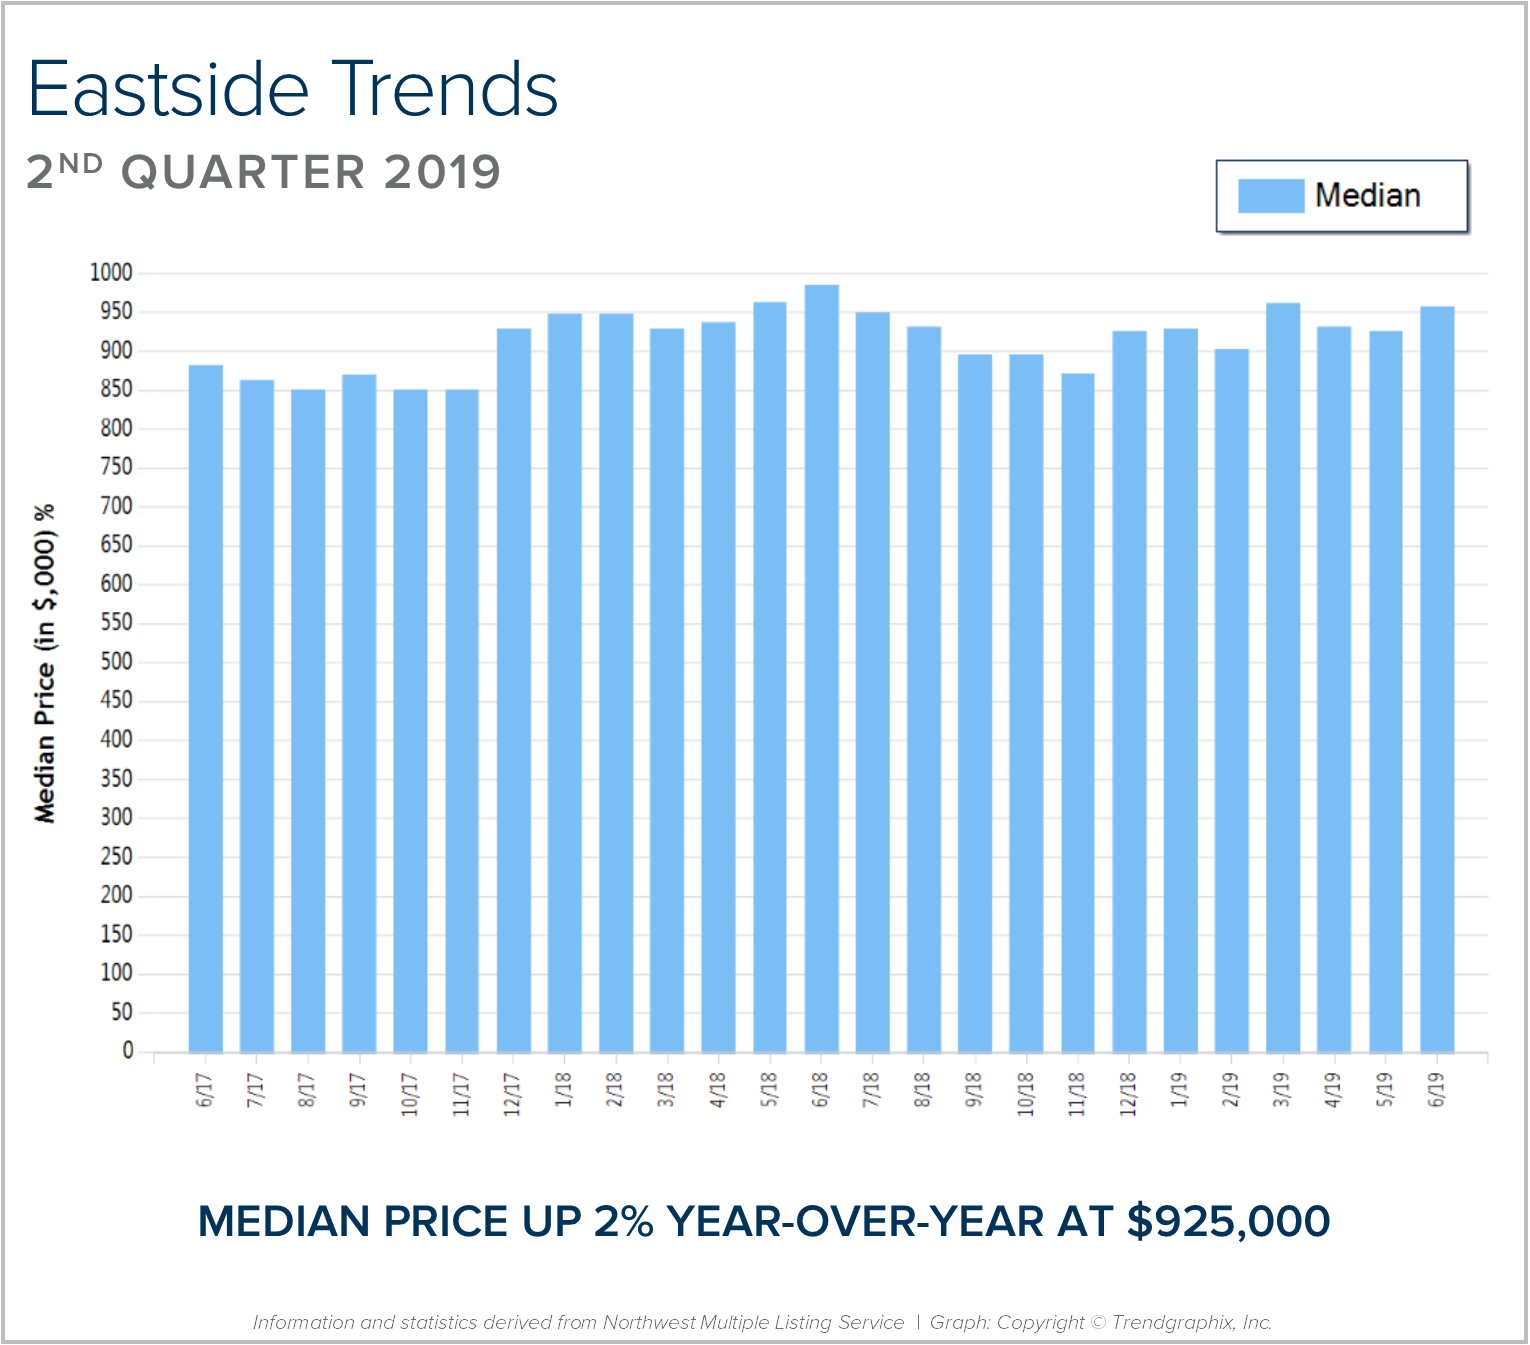
 2019 provided a very healthy and more balanced spring market! Median price is up 2% year-over-year at $925,000. Prices have started to find their balance as more inventory has come to market compared to the scarcity of years past. While buyers have had more choices over the last year, it is still a seller’s market with just 2 months of inventory based on pending sales, resulting in an average of 30 days on market and 98% list-to-sale price ratio in June. Low interest rates continue to drive demand, however sellers who overprice or don’t address condition issues will linger on the market, illustrated by the 27% increase in carryover inventory.
Our real estate market continues to be driven by low interest rates, positive job creation, and upbeat consumer sentiment. Currently, interest rates sit around 4% which is still an historical low, affording buyers the ability to make moves and reduce their debt service. Price appreciation has started to temper to more normal rates, compared to the double-digit appreciation we experienced over the last 3 years due to more sellers coming to market. This has created more balance and greater opportunity for buyers. The generational shift we are experiencing as Baby Boomers move towards retirement and Millennials enter into their prime earning years is an exciting exchange happening in the market place right now.
This is only a snapshot of the trends on the Eastside; please contact me if you would like further explanation of how the latest trends relate to you.
Seattle Metro Quarterly Market Trends – Q2 2019
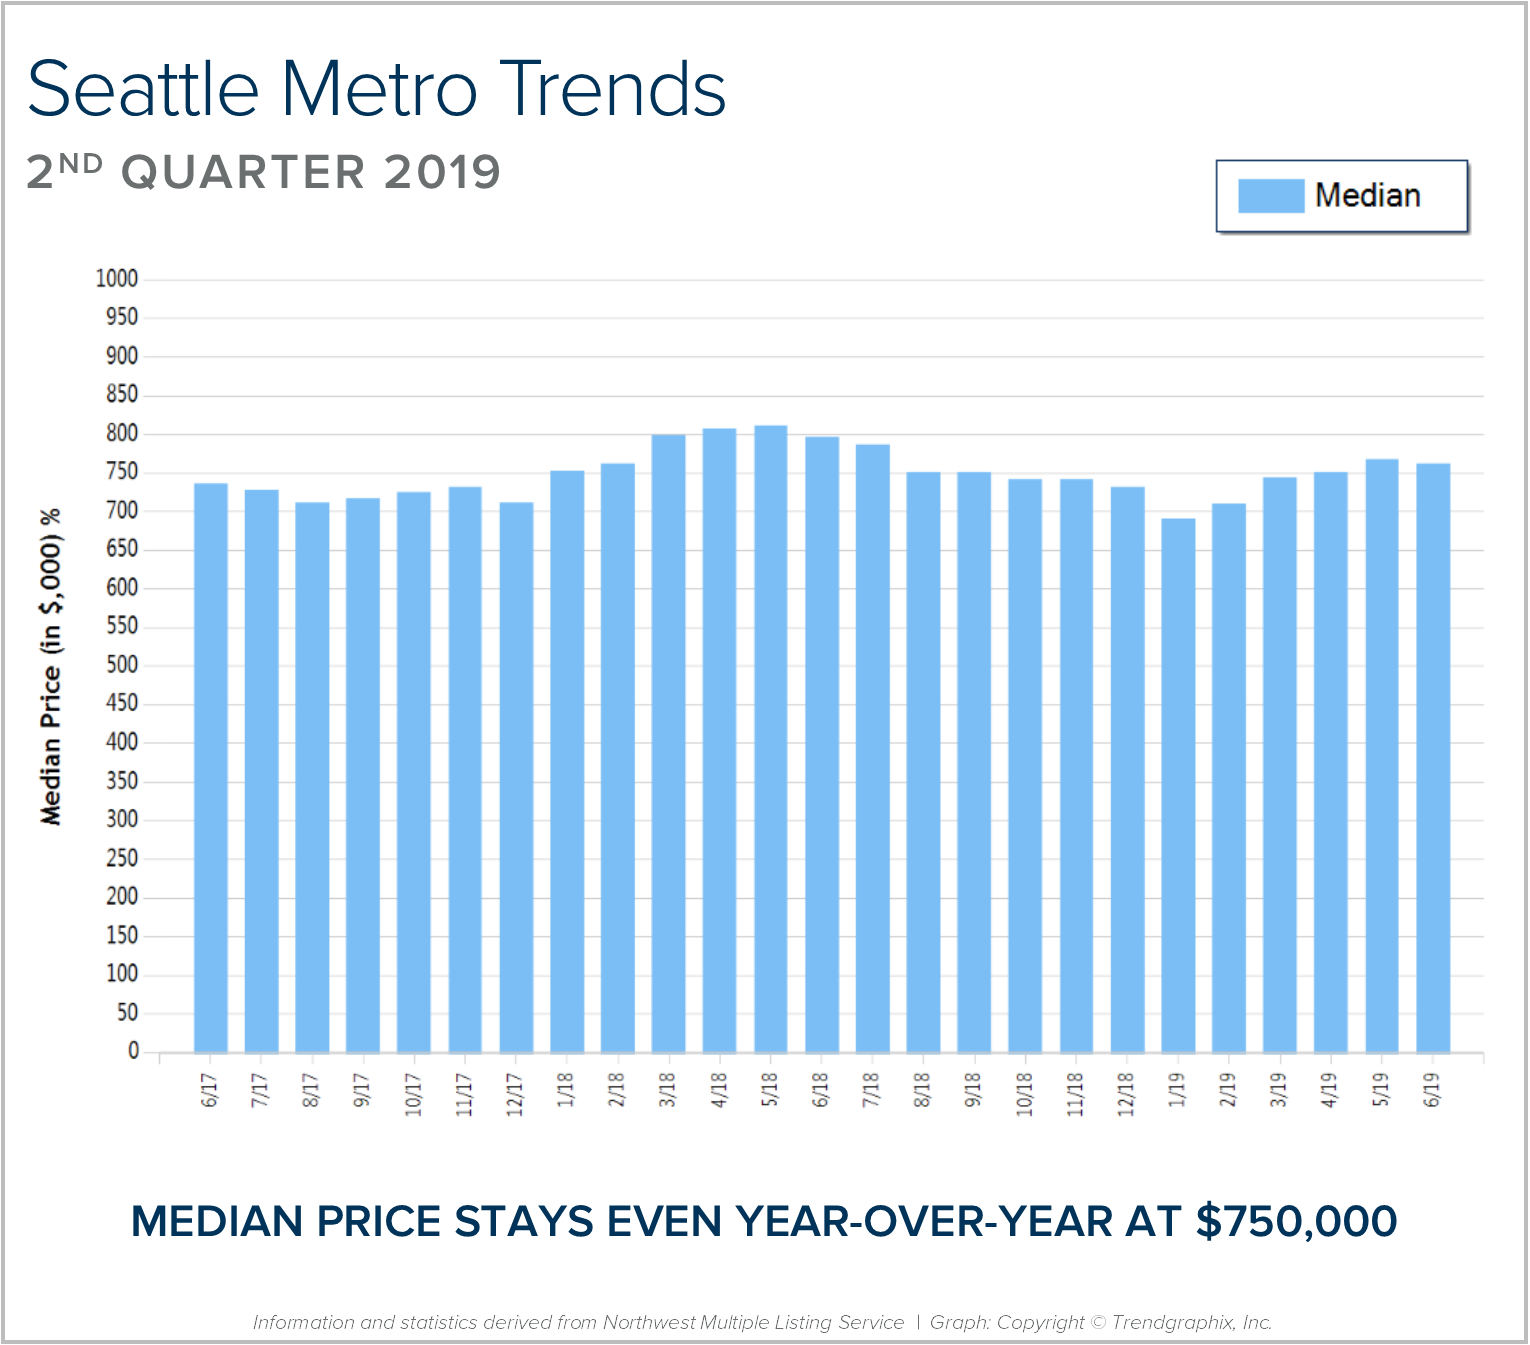
 2019 provided a very healthy and more balanced spring market! Median price is even year-over-year at $750,000. Prices have started to find their balance as more inventory has come to market compared to the scarcity of years past. While buyers have had more choices over the last year, it is still a seller’s market with just 1.7 months of inventory based on pending sales, resulting in an average of 23 days on market and 99% list-to-sale price ratio in June. Low interest rates continue to drive demand, however sellers who overprice or don’t address condition issues will linger on the market, illustrated by the 66% increase in carryover inventory.
Our real estate market continues to be driven by low interest rates, positive job creation, and upbeat consumer sentiment. Currently, interest rates sit around 4% which is still an historical low, affording buyers the ability to make moves and reduce their debt service. Price appreciation has started to temper to more normal rates, compared to the double-digit appreciation we experienced over the last 3 years due to more sellers coming to market. This has created more balance and greater opportunity for buyers. The generational shift we are experiencing as Baby Boomers move towards retirement and Millennials enter into their prime earning years is an exciting exchange happening in the market place right now.
This is only a snapshot of the trends in the Seattle Metro area; please contact me if you would like further explanation of how the latest trends relate to you.
North King County Quarterly Market Trends – Q2 2019
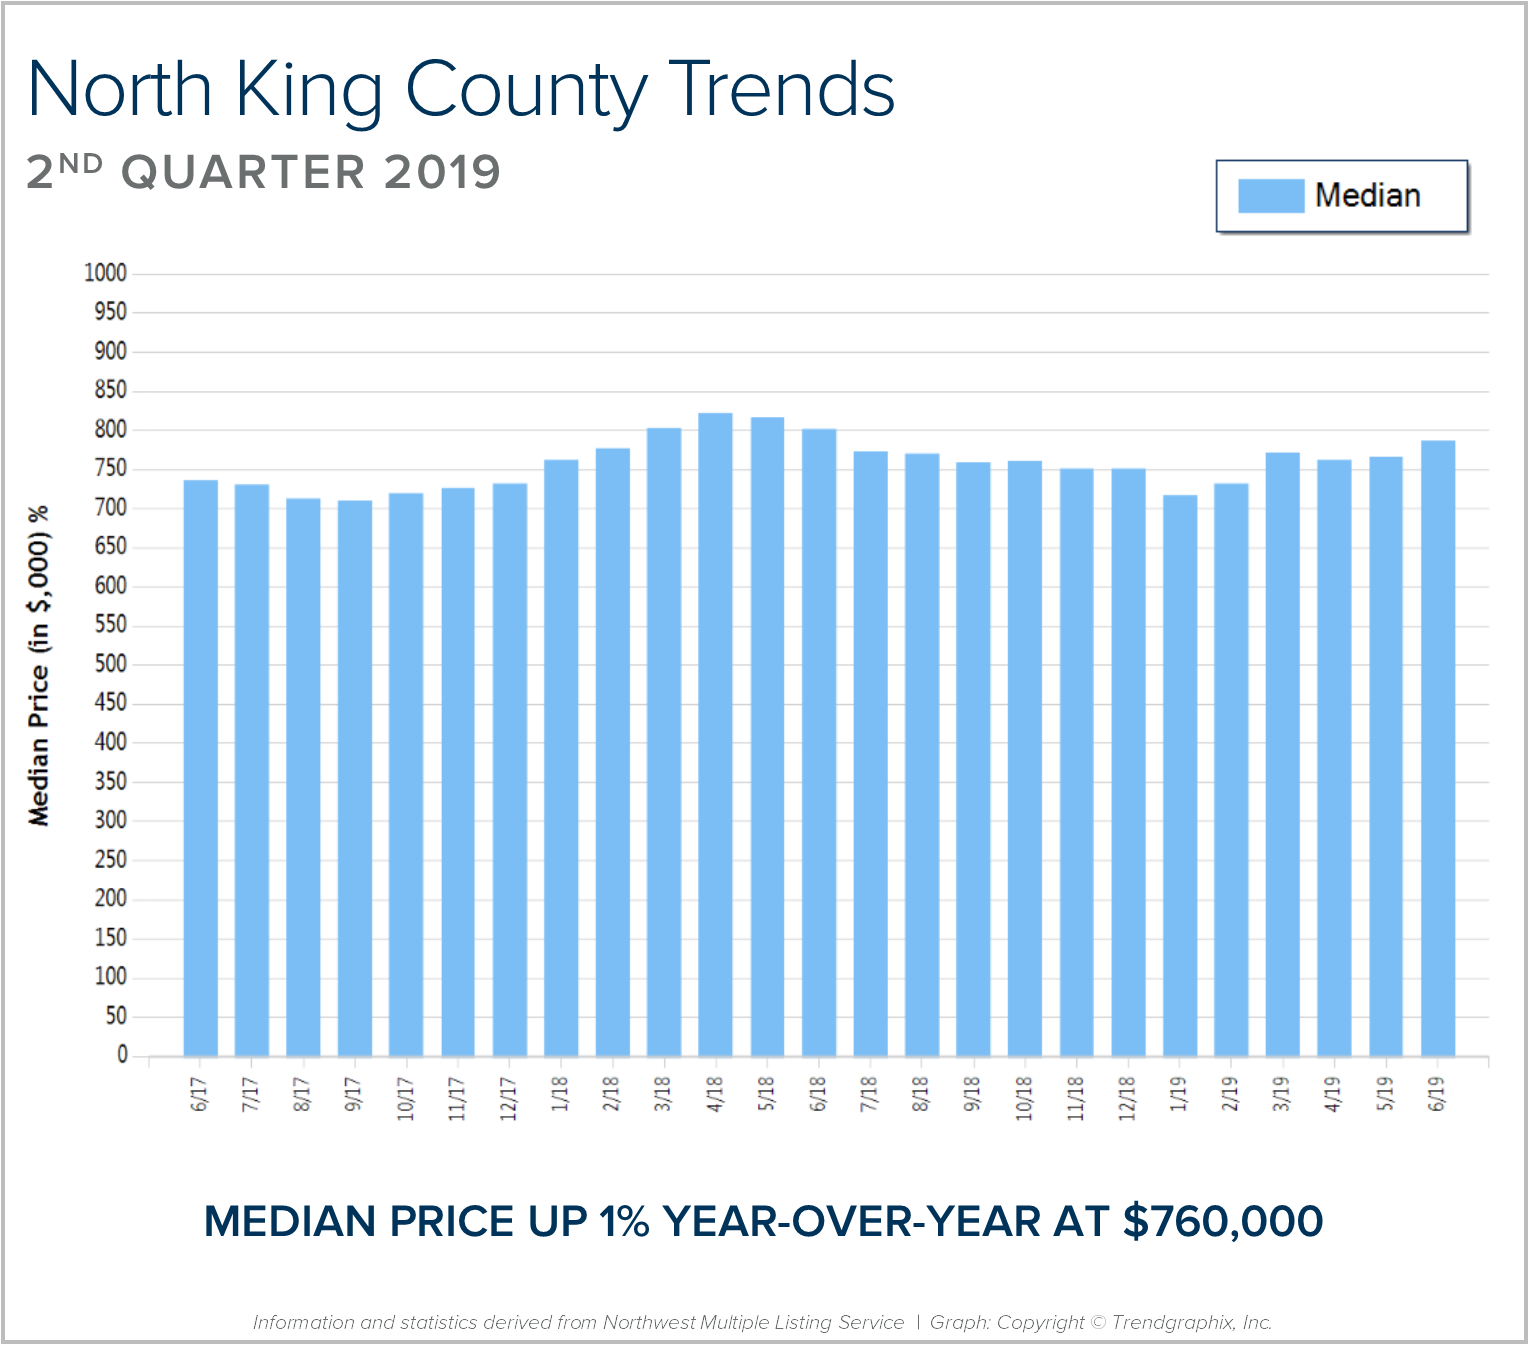
 2019 provided a very healthy and more balanced spring market! Median price is up 1% year-over-year at $760,000. Prices have started to find their balance as more inventory has come to market compared to the scarcity of years past. While buyers have had more choices over the last year, it is still a seller’s market with just 1.6 months of inventory based on pending sales, resulting in an average of 23 days on market and 99% list-to-sale price ratio in June. Low interest rates continue to drive demand, however sellers who overprice or don’t address condition issues will linger on the market, illustrated by the 60% increase in carryover inventory.
Our real estate market continues to be driven by low interest rates, positive job creation, and upbeat consumer sentiment. Currently, interest rates sit around 4% which is still an historical low, affording buyers the ability to make moves and reduce their debt service. Price appreciation has started to temper to more normal rates, compared to the double-digit appreciation we experienced over the last 3 years due to more sellers coming to market. This has created more balance and greater opportunity for buyers. The generational shift we are experiencing as Baby Boomers move towards retirement and Millennials enter into their prime earning years is an exciting exchange happening in the market place right now.
This is only a snapshot of the trends in north King County; please contact me if you would like further explanation of how the latest trends relate to you.
South Snohomish County Quarterly Market Trends – Q2 2019
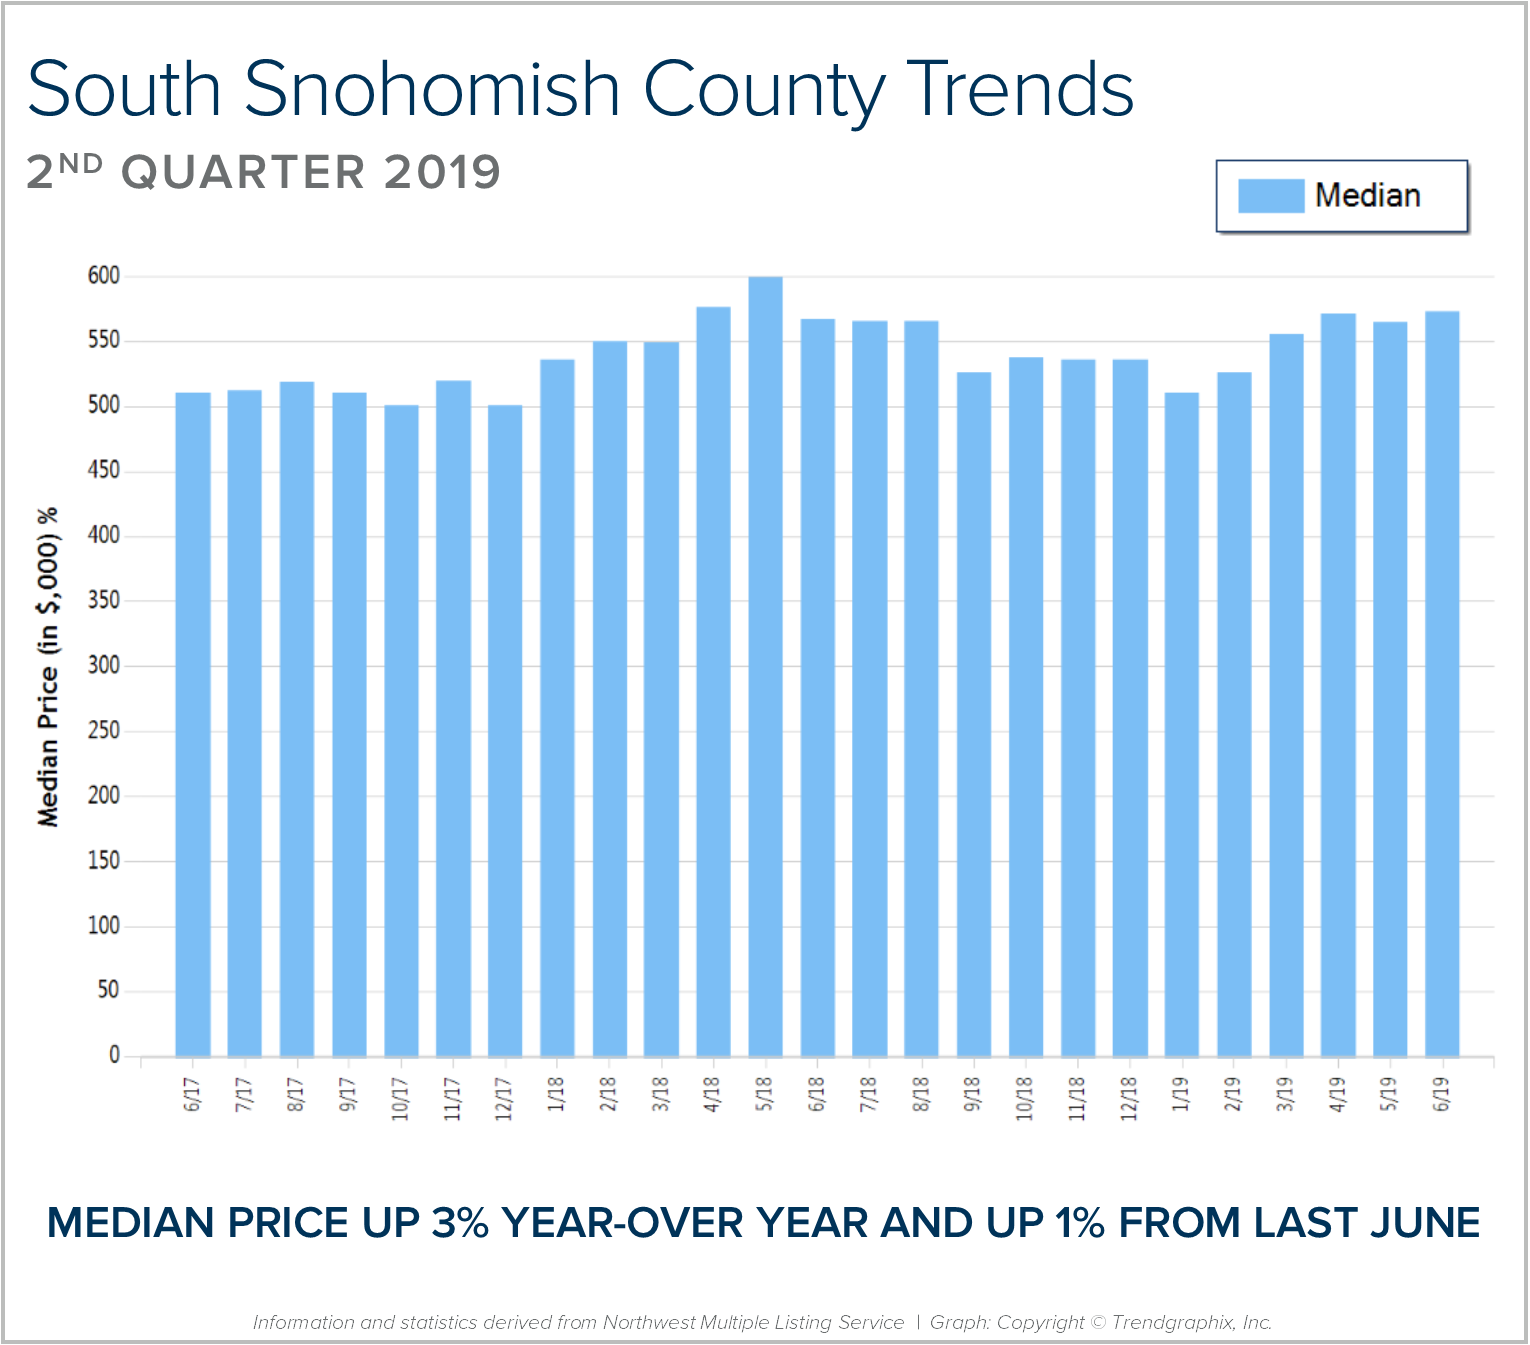
 2019 provided a very healthy and more balanced spring market! Median price is up 3% complete year-over-year and up 1% from last June. Prices have started to find their balance as more inventory has come to market compared to the scarcity of years past. While buyers have had more choices over the last year, it is still a seller’s market with just 1.5 months of inventory based on pending sales, resulting in an average of 21 days on market and 99% list-to-sale price ratio in June. Low interest rates continue to drive demand, however sellers who overprice or don’t address condition issues will linger on the market, which is illustrated by the 16% increase in carryover inventory year-over-year.
Our real estate market continues to be driven by low interest rates, positive job creation, and upbeat consumer sentiment. Currently, interest rates sit around 4% which is still an historical low, affording buyers the ability to make moves and reduce their debt service. Price appreciation has started to temper to more normal rates, compared to the double-digit appreciation we experienced over the last 3 years due to more sellers coming to market. This has created more balance and greater opportunity for buyers. The generational shift we are experiencing as Baby Boomers move towards retirement and Millennials enter into their prime earning years is an exciting exchange happening in the market place right now.
This is only a snapshot of the trends in south Snohomish County; please contact me if you would like further explanation of how the latest trends relate to you.
North Snohomish County Quarterly Market Trends – Q2 2019
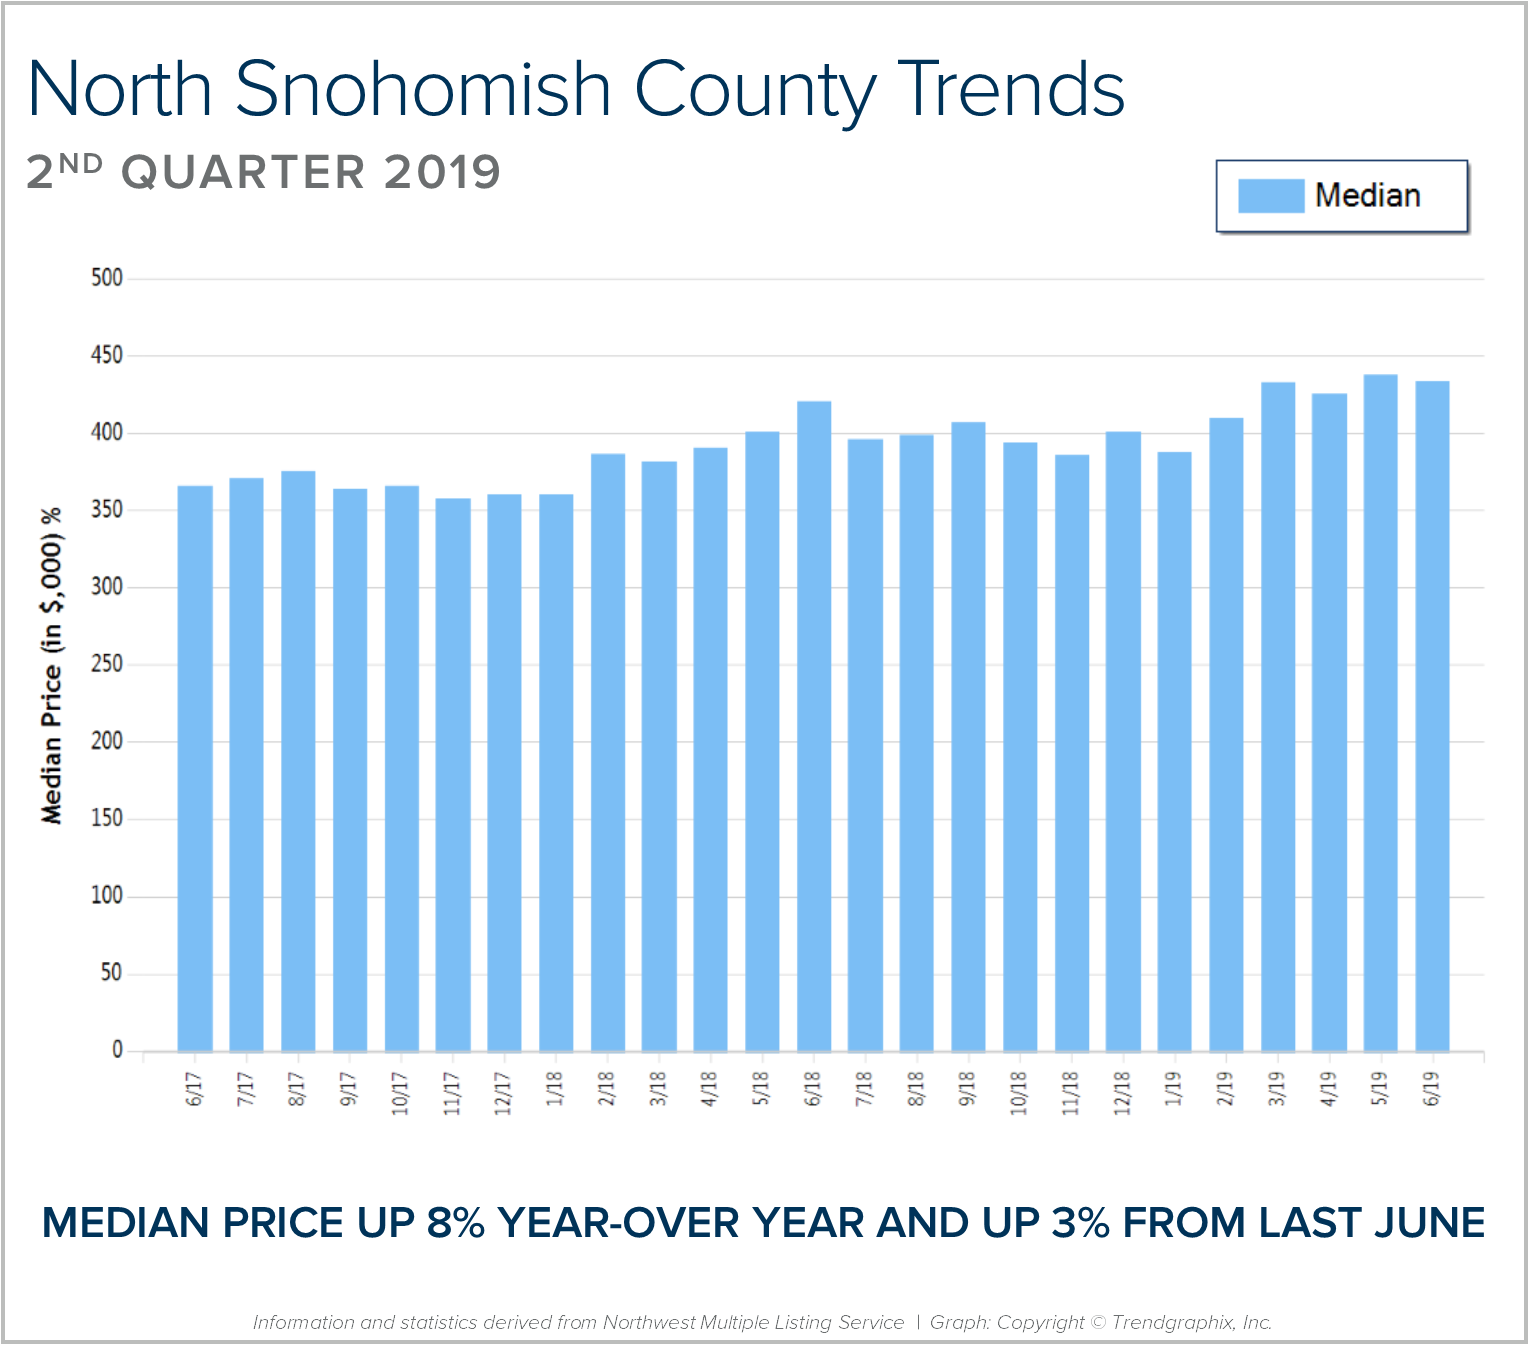
 2019 provided a very healthy and more balanced spring market! Median price is up 8% complete year-over-year and up 3% from last June. Prices have started to find their balance as more inventory has come to market compared to the scarcity of years past. While buyers have had more choices over the last year, it is still a seller’s market with just 1.3 months of inventory based on pending sales, resulting in an average of 23 days on market and 100% list-to-sale price ratio in June. Low interest rates continue to drive demand, however sellers who overprice or don’t address condition issues will linger on the market, which is illustrated by the 15% increase in carryover inventory year-over-year.
Our real estate market continues to be driven by low interest rates, positive job creation, and upbeat consumer sentiment. Currently, interest rates sit around 4% which is still an historical low, affording buyers the ability to make moves and reduce their debt service. Price appreciation has started to temper to more normal rates, compared to the double-digit appreciation we experienced over the last 3 years due to more sellers coming to market. This has created more balance and greater opportunity for buyers. The generational shift we are experiencing as Baby Boomers move towards retirement and Millennials enter into their prime earning years is an exciting exchange happening in the market place right now.
This is only a snapshot of the trends in north Snohomish County; please contact me if you would like further explanation of how the latest trends relate to you.
Washington Real Estate Excise Tax Changes

Changes are coming: The Washington State Legislature is changing the way in which real estate excise taxes (REET) are calculated. REET are different from your annual property taxes; they are the tax that a seller pays when they sell their home, based on the sale price.
Currently, the Washington State excise tax is 1.28 percent. Local municipalities add their excise tax on top of the state tax, with most cities in our area adding 0.50 percent, to total 1.78 percent. Effective January 1, 2020, Washington State will begin calculating real estate excise taxes based on a tier system. Below are examples of how this change will affect the difference price points.
The majority of sellers will enjoy a slight savings once the new tax structure starts in 2020, however, sellers whose homes are worth $1.5M or more should pay close attention as the tiered system will cost them more in 2020. If you own a high-end home and have been considering downsizing, doing so inside of 2019 may be a winning strategy.
If you or someone you know is curious about the value of your home or you have considered a move, please reach out. It is my goal to help keep my clients informed and empower strong decisions.
June Newsletter

Changes are coming: The Washington State Legislature is changing the way in which real estate excise taxes (REET) are calculated. REET are different from your annual property taxes; they are the tax that a seller pays when they sell their home, based on the sale price.
Currently, the Washington State excise tax is 1.28 percent. Local municipalities add their excise tax on top of the state tax, with most cities in our area adding 0.50 percent, to total 1.78 percent. Effective January 1, 2020, Washington State will begin calculating real estate excise taxes based on a tier system. Below are examples of how this change will affect the difference price points.
The majority of sellers will enjoy a slight savings once the new tax structure starts in 2020, however, sellers whose homes are worth $1.5M or more should pay close attention as the tiered system will cost them more in 2020. If you own a high-end home and have been considering downsizing, doing so inside of 2019 may be a winning strategy.
If you or someone you know is curious about the value of your home or you have considered a move, please reach out. It is my goal to help keep my clients informed and empower strong decisions.
On June 7th, my office spent our annual Community Service Day with the Snohomish Garden Club constructing trellises, weeding and staking beds and planting and labeling a half-acre of produce!
The Snohomish Garden Club will harvest this half-acre, which will yield close to 10,000 pounds of fresh produce to be donated to various food banks and senior centers in Snohomish County. The land for the garden is generously donated by the Bailey Family Farm.
For more information on how you can lend a hand, please visit: SnohomishGardenClub.com
Windermere’s Community Service Day was established in 1984 to offer agents and staff a chance to volunteer an entire workday to give back to the neighborhoods in which they live and work.
The longer days and warmer weather means that your favorite movie is no longer relegated only to a dark stuffy room. Grab the folding chairs, blankets and popcorn, and check out a few of these fun outdoor movies. You’ll find classics like Ferris Bueller’s Day Off and The Princess Bride, as well as newer releases like Mary Poppins Returns and Spider Man: Into the Spider-Verse. Most of them are free, and many locations also offer fun, family-friendly activities before the movie starts

 Facebook
 X
X
 Pinterest
 Copy Link


