 Facebook
 X
X
 Pinterest
 Copy Link
Does it make more sense to rent or own?


The current break-even horizon* in the Seattle metro area is 1.6 years!
*The amount of time you need to own your home in order for owning to be a superior financial decision.
With rising rental rates, historically low interest rates, and home prices on the rise, the advantage of buying vs. renting is becoming clearer each month.
In fact, Seattle has seen some of the sharpest rent hikes in the country over the last year! Snohomish County has seen a huge increase in apartment growth and rising rental rates as well. There are several factors to consider that will lead you to make the best decision for your lifestyle and your financial bottom line. Zillow Research has determined the break-even point for renting vs. buying in our metro area. In other words, the amount of time you need to own your home in order for owning to be a superior financial decision. Currently in Seattle the break-even point is 1.6 years – that is quick! What is so great about every month that ticks away thereafter is that your nest egg is building in value.
I am happy to help you or someone you know assess your options; please contact me anytime.
These assumptions are based on a home buyer purchasing a home with a 30-year, fixed-rate mortgage and a 20 percent down payment; and a renter earning five percent annually on investments in the stock market.
North Snohomish County Quarterly Market Trends
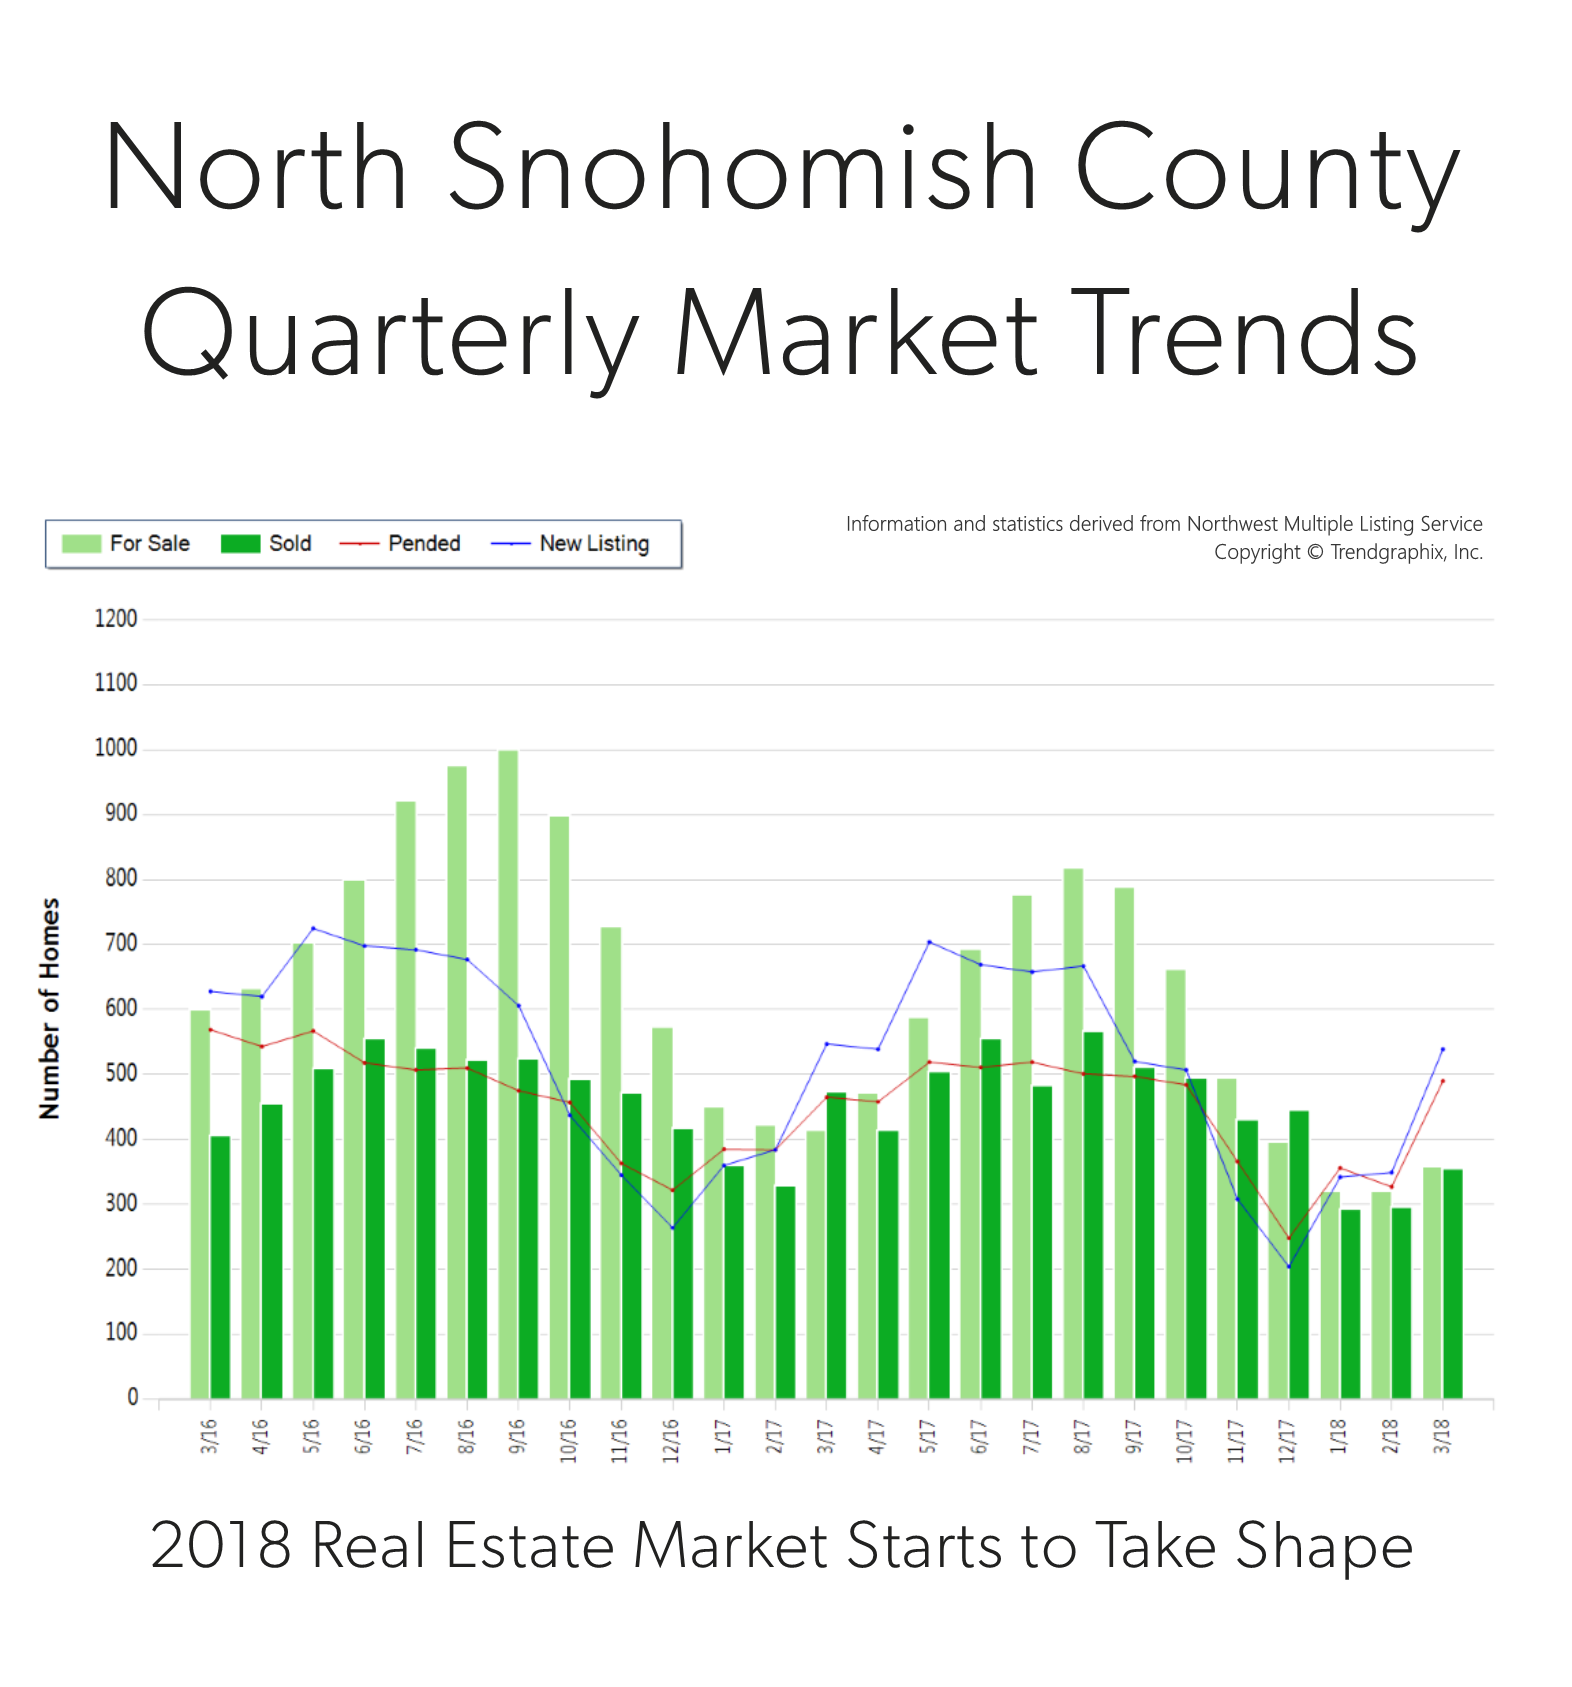

It is the time of year when our market starts to take off. Spring is here and we are starting to see seasonal increases in inventory. In fact, there was a 54% increase in new listings in March compared to February. That increase was matched by a 50% rise in pending sales, illustrating very strong demand for housing in your area. Last month, the average list-to-sale price ratio was 100%, and average days on market was 35 days. We ended the quarter with 0.7 months of inventory – the lowest level yet. More inventory would be absorbed by happy buyers looking for more selection and would help temper price growth, which is up 12% year-over-year.
North Snohomish County is one of the most affordable markets in the area. In fact, the median price in March was 28% higher in south Snohomish County. Buyers are migrating to the area, especially if they don’t have to commute into the city. Sellers are enjoying amazing returns due to this phenomenon, and buyers are securing mortgages with minor debt service due to low interest rates. This is a very strong seller’s market, but buyers who are securing a home are already enjoying appreciation in equity.
This is only a snapshot of the trends in north Snohomish County; please contact me if you would like further explanation of how the latest trends relate to you.
Seattle Metro Quarterly Market Trends
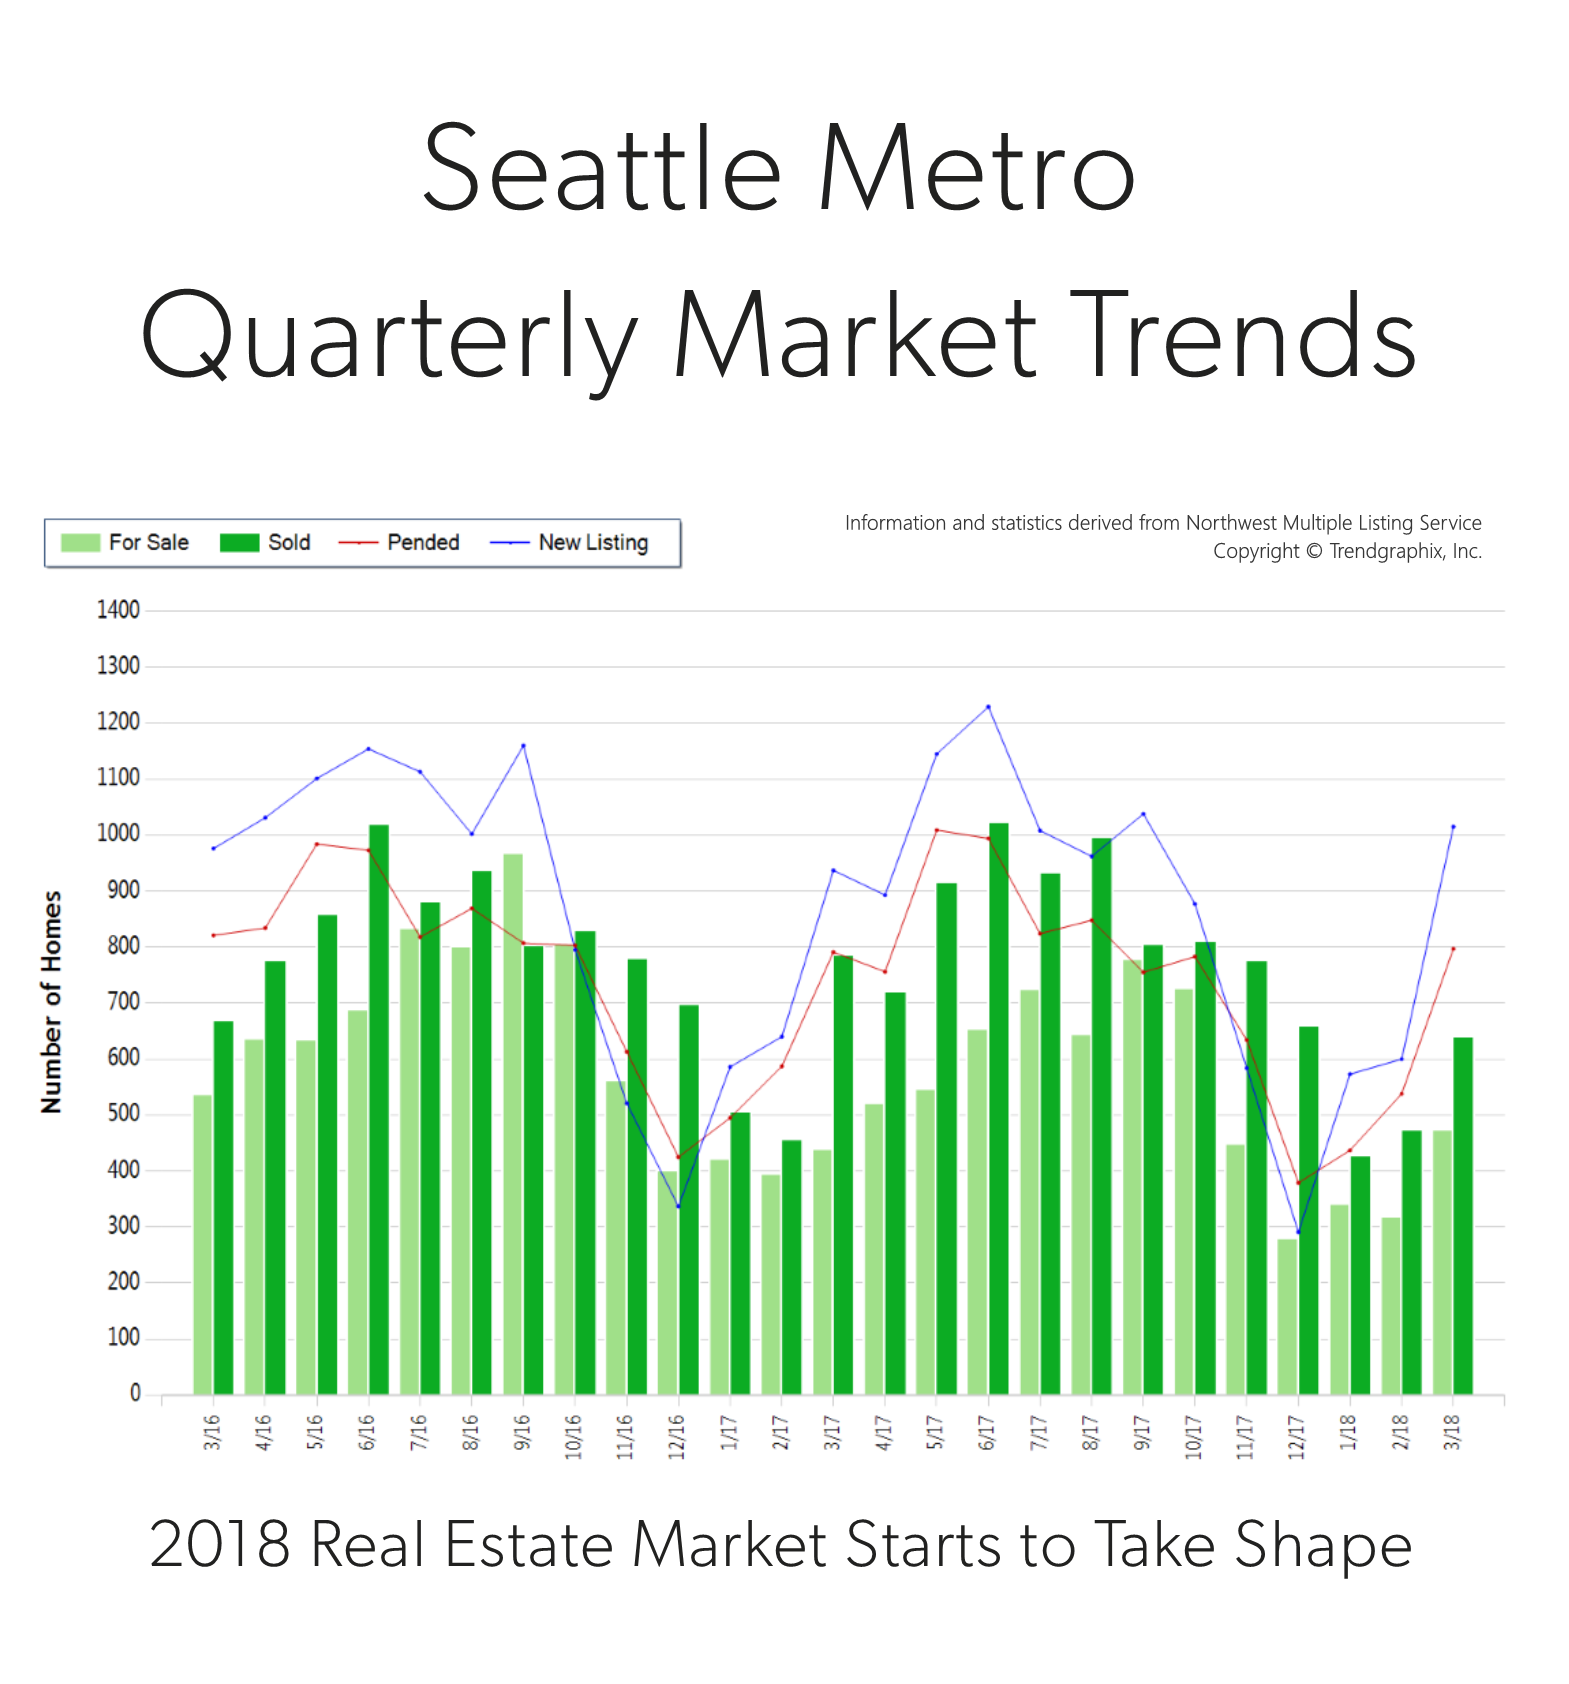
It is the time of year when our market starts to take off. Spring is here and we are starting to see seasonal increases in inventory. In fact, there was a 69% increase in new listings in March compared to February. That increase was followed by a 48% rise in pending sales, illustrating very strong demand for housing in your area. Last month, the average list-to- sale price ratio (the amount the sale price topped the list price) was 105%, indicating that multiple offers were the norm. We ended the quarter with 0.6 months of inventory based on pending sales. More inventory would be absorbed by happy buyers looking for more selection and would help temper price growth, which is up 16% year-over- year.
Seattle Metro real estate has a very high premium due to close-in commute times and vibrant neighborhoods. In fact, the median price in March was $800,000, up 5% from the month prior! Sellers are enjoying amazing returns due to this phenomenon, and buyers are securing mortgages with minor debt service due to low interest rates. This is a very strong seller’s market, but buyers who are securing a home are already enjoying appreciation in equity.
This is only a snapshot of the trends in the Seattle Metro area; please contact me if you would like further explanation of how the latest trends relate to you.

Interest Rates and Your Bottom Line
 Wow, just wow! The interest rate levels that we have experienced in 2016 are seriously unbelievable. Currently we are hanging around 3.5% for a 30-year fixed conventional mortgage, almost a half a point down from a year ago. This is meaningful because the rule of thumb is that for every one-point increase in interest rate a buyer loses ten percent in buyer power. For example, if a buyer is shopping for a $500,000 home and the rate increases by a point during their search, in order to keep the same monthly payment the buyer would need to decrease their purchase price to $450,000. Conversely, for every decrease in interest rate, a buyer can increase their purchase price and keep the same monthly mortgage payment.
Why is this important to pay attention to? Affordability! If you take the scenario I just described and apply it to the graph above, you can see that the folks who jumped into the market this year enjoyed an interest cost savings when securing their mortgage. This cost savings is doubly important because we are in a price appreciating market. In fact, the median price in King County has increased by 13% year-over-year and 10% in Snohomish County. Interest rates are helping to keep payments more manageable in our appreciating market. Most recently we have started to see a slight increase in inventory compared to the spring/summer market, which is a plus for buyers and something to be taken advantage of.
Will these rates last forever? Simply put, no! The graph above provided by Freddie Mac shows a prediction for rates to start rising. While still staying well below the 30-year average of 7.65%, increases are increases, and securing these rates could be downright historical. Just like the 1980’s when folks were securing mortgages at 18%, the people that lock down on a rate from today will be telling these stories to their grandchildren. Another factor to consider is that it is an election year, and rates historically remain level during these times. What 2017 and beyond hold for rates will likely not mirror these historical lows under 4%. Note the 30-year average – one must think that rates closer to that must be in our future at some point.
So what does this mean for you? If you have considered making a move, or even your first purchase, today’s rates are a huge plus in helping make that transition more affordable. If you are a seller, bear in mind that today’s interest rate market is creating strong buyer demand, providing a healthy buyer pool for your home. As a homeowner who has no intention to make a move, now might be the time to consider a refinance. What is so exciting about these refinances, is that it is not only possible to reduce your monthly payment, but also your term, depending on which rate you would be coming down from.
If you would like additional information on how today’s historical interest rates pertain to your housing goals, please contact me. I would be happy to educate you on homes that are available, do a market analysis on your current home, and/or put you in touch with a reputable mortgage professional to help you crunch numbers. Real estate success is rooted in being accurately informed, and it is my goal to help empower you to make sound decisions for you and your family.
