 Facebook
 Twitter
 Pinterest
 Copy Link
You Don’t Need Tulips for a Strong Home Sale
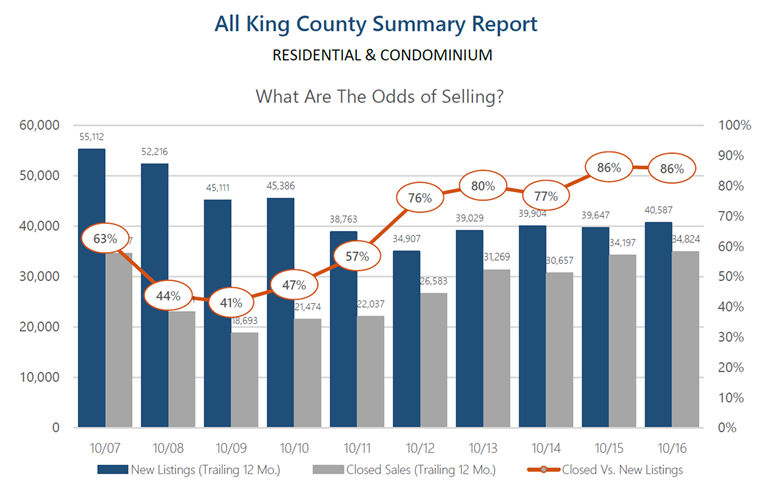
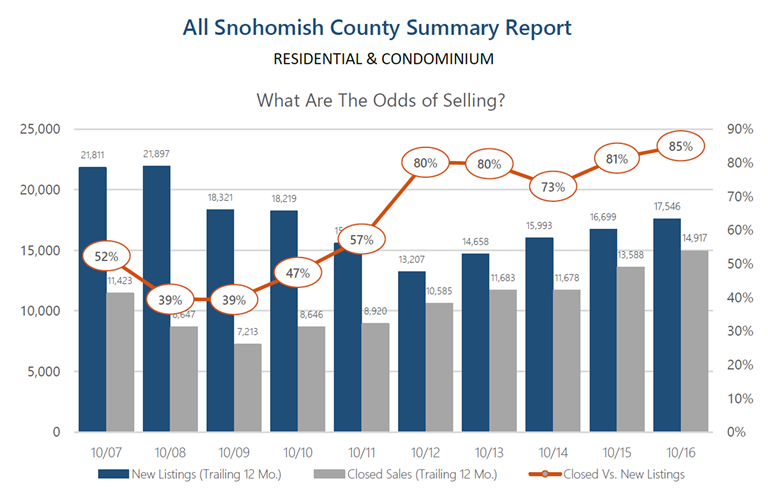 These graphs above provide a 10-year history of the odds of selling in the month of October for both King and Snohomish Counties. As you can see, the odds of selling are at a 10-year high, hitting 86% in King and 85% in Snohomish. These are quite favorable odds for sellers and indicate what one might expect moving toward 2017.
Buyer demand remains very strong! In fact, pending sales reached peak levels in May of this year and continued with steady momentum throughout the summer and fall. Every month this year recorded a higher pending level than the same month the previous year. This illustrates strong buyer demand and is coupled with lower inventory levels than the year before. This combination has created very low months of available inventory, and we anticipate this continuing as we complete 2016 and head into 2017. For a potential seller, this means the market is in your favor, and waiting until the tulips bloom in April might have you lined up against more competition. Historically, we see inventory peak April through June, however pending sales have closely matched supply all throughout the year. With that said, one might consider bringing their home to market in the first quarter of the year versus the second, because they will have less competition, but still enjoy an engaged buyer audience.
Most recently we have seen interest rates bump up a bit, and this has created more urgency in the market. While still historically low, buyers are smart enough to know that cheap money is a huge long-term savings. Paying attention to all of these market factors will empower one to make the best real estate decisions. Please reach out if you are considering a move over the next year, and I’d be happy to apply this research and weigh in on your options.
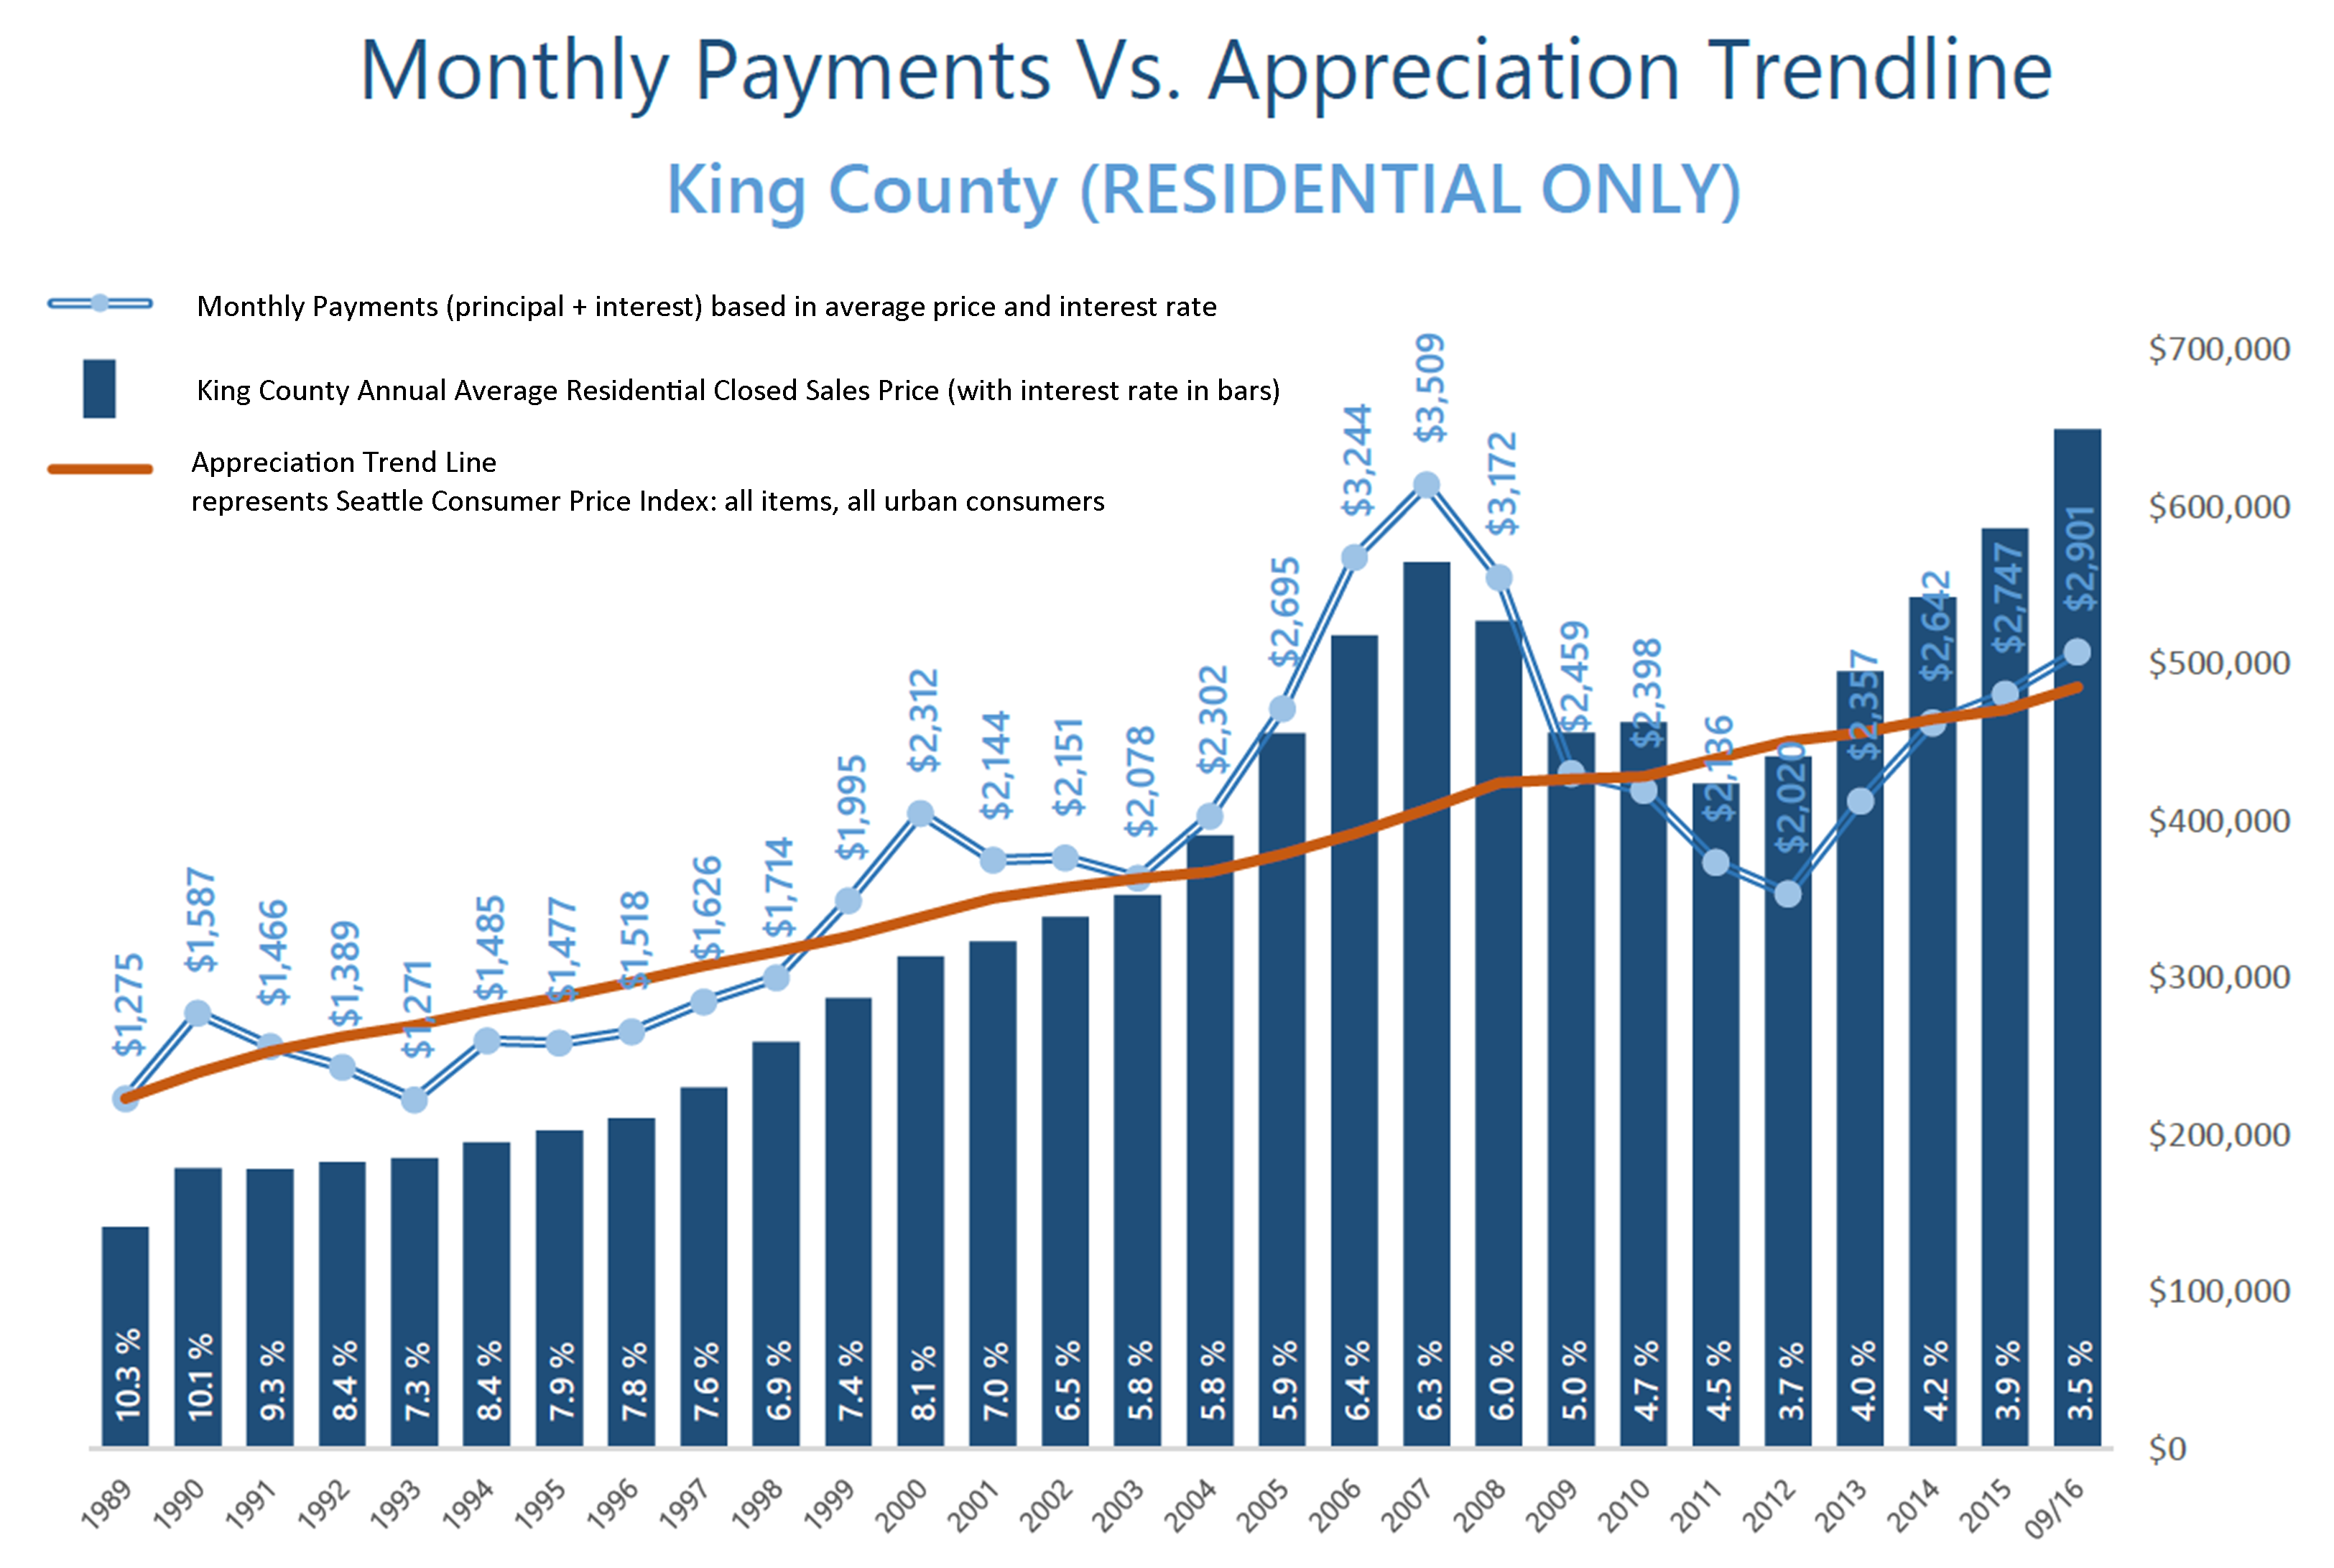
Affordability: Commute Times & Interest Rates
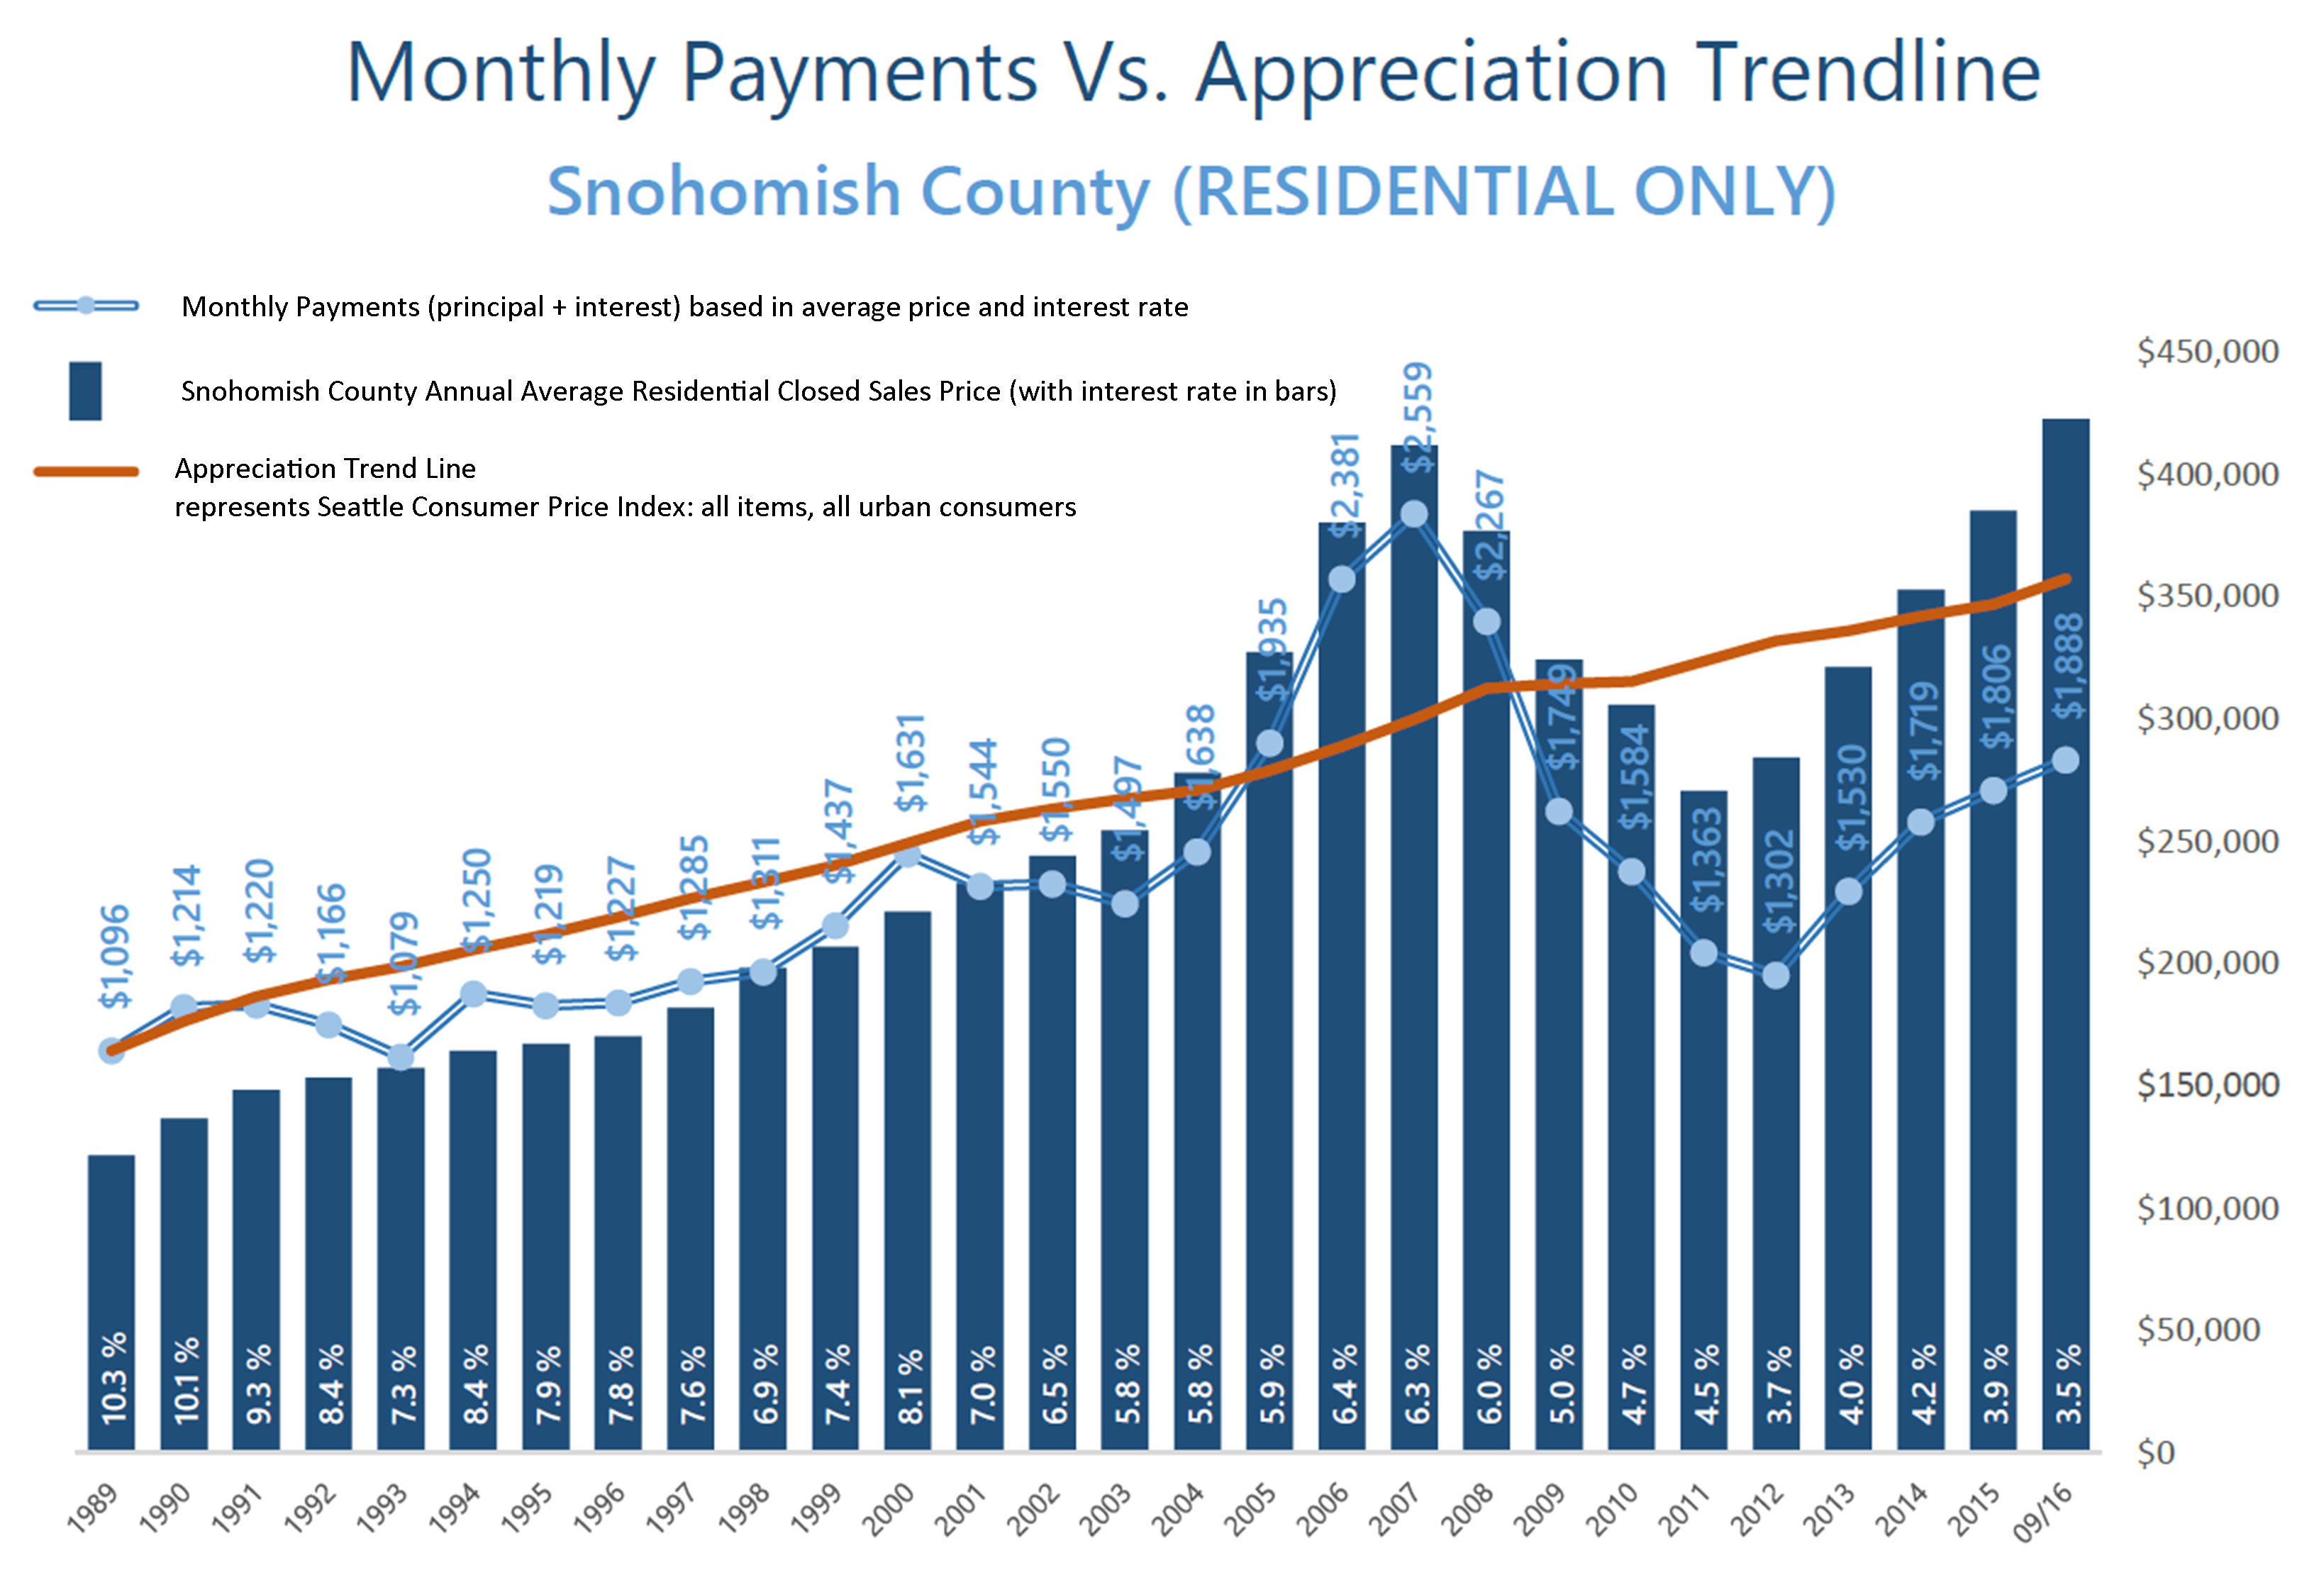 The graphs here illustrate the brass tacks of affordability between King and Snohomish Counties, measured by the average monthly payment. Most recently in September, the average monthly payment was 35% higher in King County compared to Snohomish County. What is fascinating, though, is comparing today’s average monthly payment to peak monthly payments back in 2007! In King County, monthly payments are currently 21% less than during the peak, and in Snohomish County, 36% less. That is a lot of saved monthly overhead. Note that this has everything to do with today’s historical interest rates, as average prices are higher now than in 2007. When one buys or refinances a house, they are not only securing the property, but securing the rate for the life of the loan.
Close proximity to the work place and affordability is often near the top of a buyer’s list of preferred features. 2016 has continued to be a year when commute times to major job centers widened the price divide between key market areas in the greater Seattle area. Over the last 12 months, the average sales price for a single-family residential home in the Seattle Metro area was $696,000! In south Snohomish County (Everett to the King County line), the average sales price for a single-family residential home was $471,000 – 48% less than Seattle Metro. Further, if you jump across Lake Washington to the Eastside, the average sales price for a single-family residential home was $881,000 – 27% more than Seattle Metro!
 The “drive to qualify” mentality has been proven by the pending sales rate in south Snohomish County over the last 12 months. Pending sales are up 7% complete year-over-year, whereas in Seattle Metro pending sales are down 1%, and down 2% on the Eastside. I believe this is a result of affordability, more inventory choices in south Snohomish County, new construction options, lower taxes, strong school district choices, and manageable commute times. Newer transit centers and telecommuting have also opened up doors to King County’s little brother to the north as well. If you are curious about possible commute times, you can search for properties on my website based on commutes times, which is a feature provided by INRIX Drive Time. Also, I track the market in several ways, so if these graphs are interesting to you I would be happy to provide additional information relative to your specific neighborhood. Please contact me anytime, as it is my goal to help keep you informed and empower you to make strong real estate decisions.
